Tickets Analytics
Tickets let you escalate contacts from automated flows to conversations with human agents, so you can assign, respond to and close tickets without leaving your workspace. Here is a guide to setting them up.
You may want to see how your tickets and agents are performing, such as how many tickets were opened under each of your topics and the average response time of your agents.
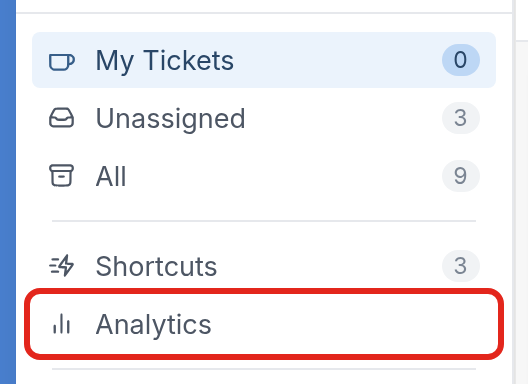
Go to Tickets and click Analytics.
The first graph, Tickets Opened, shows the number of tickets opened under one or more topics over a period of time. Set the period with the W (week), M (month), Y (year) and All buttons in the bar above the graph, on the right. To choose which topics the graph shows, click the gear icon at the bottom right of the graph.
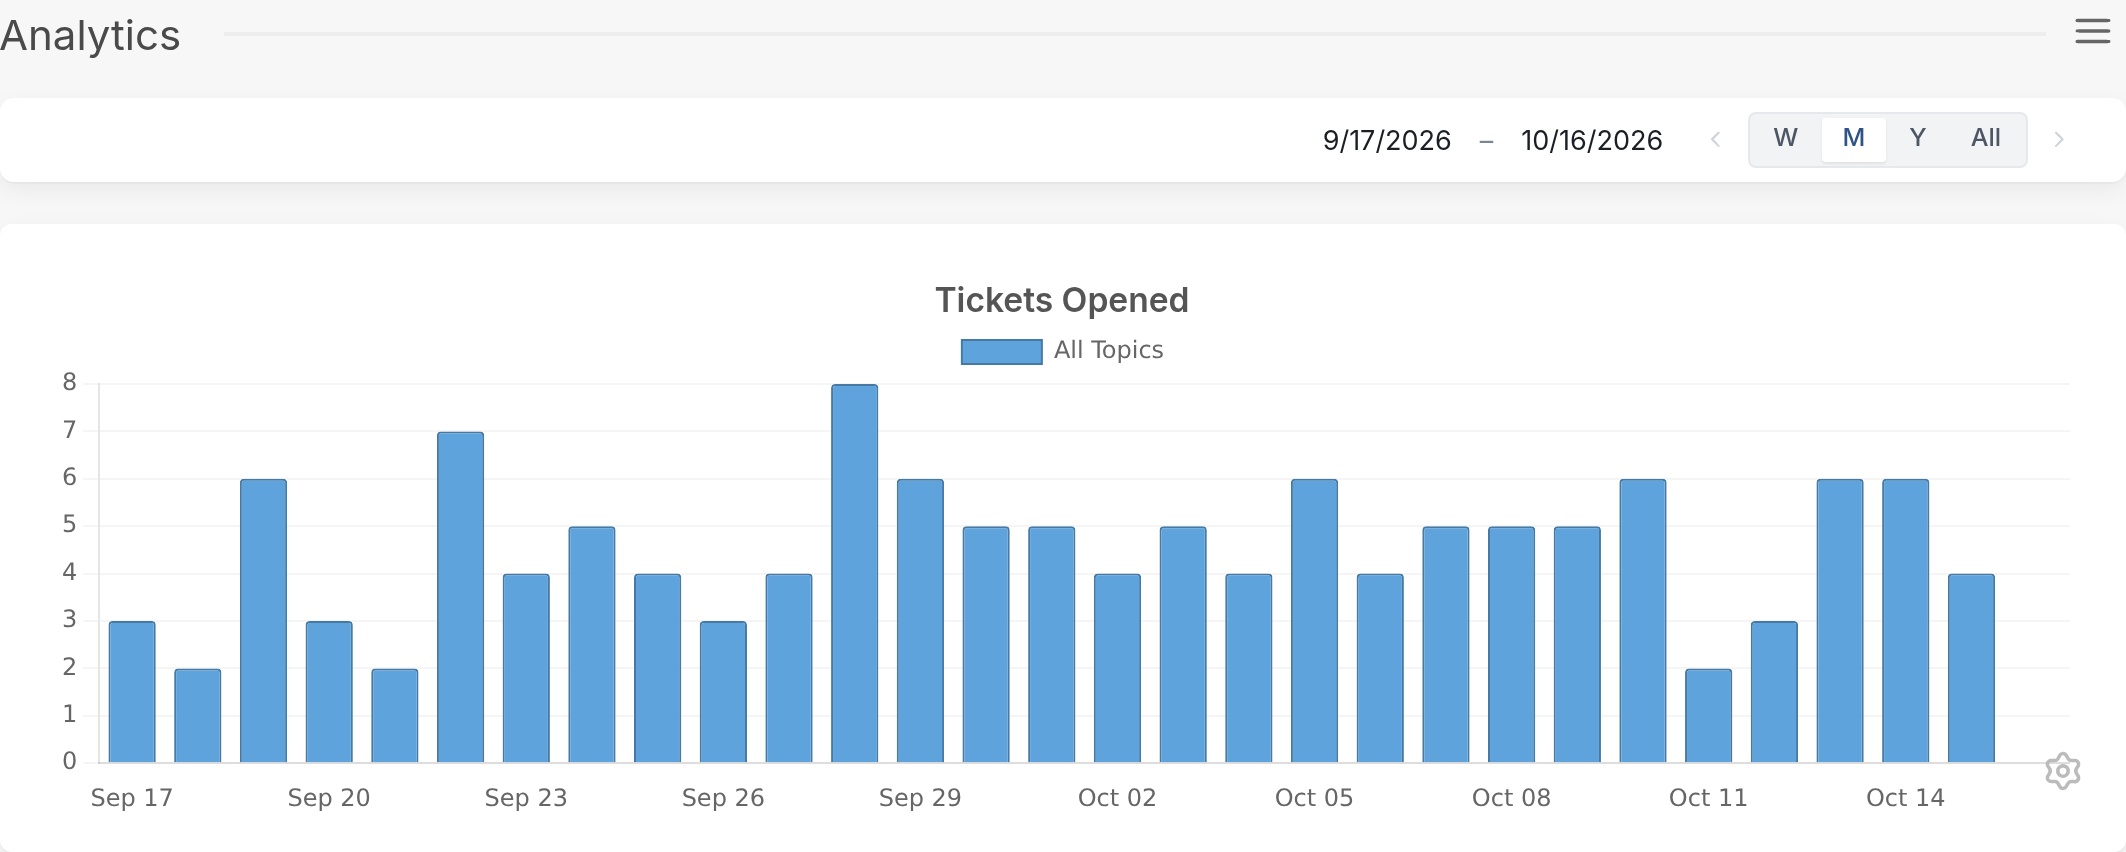
From the drop-down the gear icon opens, select the topics you want to see, such as Study Support or Financial Aid, and the graph will update.
Below it, the Response Time graph shows the average response time for all tickets over the period you selected, followed by the Response Count graph.
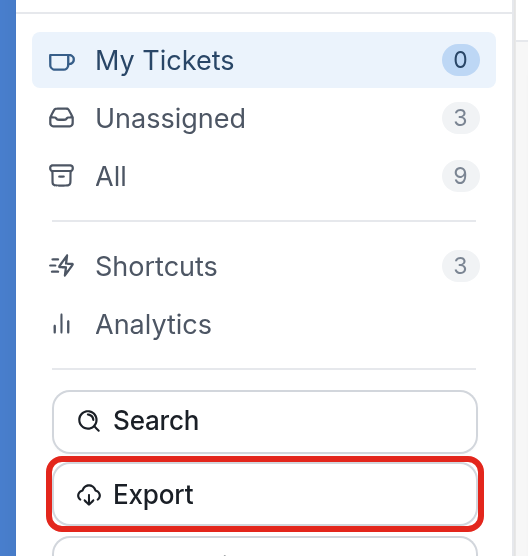
To download this data, click Export in the Tickets menu, below Search. You can choose the start and end dates the export should include.